

The bar graph shows the population of the United States, in millions, for seven selected years. Here
Question:
The bar graph shows the population of the United States, in millions, for seven selected years. 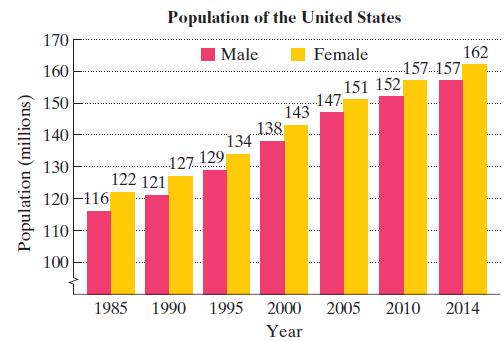 Here are two functions that model the data:
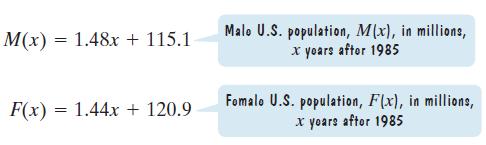 Use the functions to solve Exercises 97–98.
a. Write a function that models the difference between the female U.S. population and the male U.S. population for the years shown in the bar graph.
b. Use the function from part (a) to find how many more women than men there were in the U.S. population in 2010.
c. Does the result in part (b) overestimate or underestimate the actual difference between the female and male population in 2010 shown by the bar graph? By how much?
Fantastic news! We've Found the answer you've been seeking!
Step by Step Answer:
a b c The result in par...View the full answer

Answered By
OTIENO OBADO
I have a vast experience in teaching, mentoring and tutoring. I handle student concerns diligently and my academic background is undeniably aesthetic
3+ Reviews
10+ Question Solved
Related Book For 

Question Posted:
