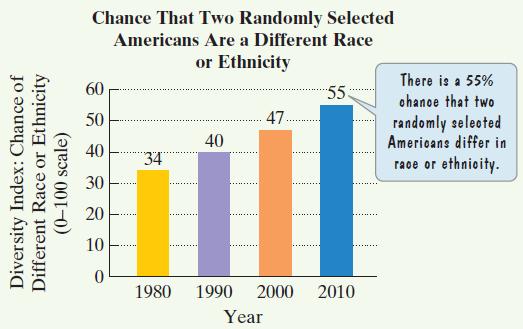
The diversity index, from 0 (no diversity) to 100, measures the chance that two randomly selected people
Question:
The diversity index, from 0 (no diversity) to 100, measures the chance that two randomly selected people are a different race or ethnicity. The diversity index in the United States varies widely from region to region, from as high as 81 in Hawaii to as low as 11 in Vermont. The bar graph shows the national diversity index for the United States for four years in the period from 1980 through 2010.
The data in the graph can be modeled by the formula D = 0.005x2 + 0.55x + 34, where D is the national diversity index in the United States x years after 1980. According to the formula, what was the U.S. diversity index in 2010? How does this compare with the index displayed by the bar graph?
Fantastic news! We've Found the answer you've been seeking!
Step by Step Answer:
Related Book For 

Question Posted:


