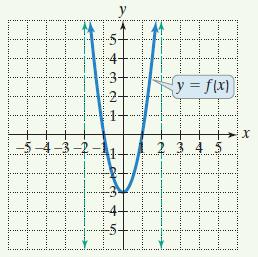
The figure shows the graph of y = f(x) and its two vertical asymptotes. a. Find the
Question:
The figure shows the graph of y = f(x) and its two vertical asymptotes.
a. Find the domain and the range of f.
b. What is the relative minimum and where does it occur?
c. Find the interval on which f is increasing.
d. Find f(-1) - f(0).
e. Find ( f ° f )(1).
f. Use arrow notation to complete this statement: f(x) → ∞ as________ or as________ .
g. Graph g(x) = f(x - 2) + 1.
h. Graph h(x) = -f(2x).
Fantastic news! We've Found the answer you've been seeking!
Step by Step Answer:
Related Book For 

Question Posted:


