

The figure shows the graphs of the cost and revenue functions for a company that manufactures and
Question:
The figure shows the graphs of the cost and revenue functions for a company that manufactures and sells small radios. Use the information in the figure to solve Exercises 55–60.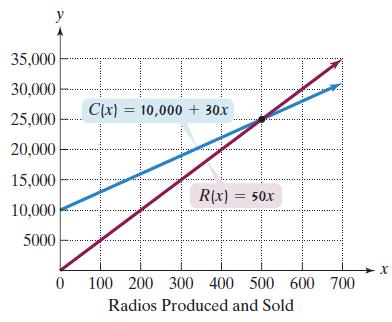
Use the formulas shown in the voice balloons to find R(300) - C(300). Describe what this means for the company.
Fantastic news! We've Found the answer you've been seeking!
Step by Step Answer:
R30050 300 15000 C3001000030300 ...View the full answer

Answered By
Caroline Kinuthia
Taking care of the smaller details in life has a larger impact in our general well being, and that is what i believe in. My name is Carol. Writing is my passion. To me, doing a task is one thing, and delivering results from the task is another thing. I am a perfectionist who always take things seriously and deliver to the best of my knowledge.
1933+ Reviews
4269+ Question Solved
Related Book For 

Question Posted:
