

The graph approximates the monthly average temperatures in degrees Fahrenheit in Austin, Texas. In this graph x
Question:
The graph approximates the monthly average temperatures in degrees Fahrenheit in Austin, Texas. In this graph x represents the month, where x = 0 corresponds to July.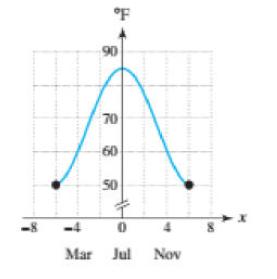
(a) Is this a graph of an odd or even function?
(b) June corresponds to x = -1 and August to x = 1. The average temperature in June is 83°F. What is the average temperature in August?
(c) March corresponds to x = -4 and November to x = 4. According to the graph, how do their average temperatures compare?
(d) Interpret what this type of symmetry implies about average temperatures in Austin.
Fantastic news! We've Found the answer you've been seeking!
Step by Step Answer:
a Since the graph of f is symmetric with respect to the y axis ...View the full answer

Answered By
Ali Khawaja
my expertise are as follows: financial accounting : - journal entries - financial statements including balance sheet, profit & loss account, cash flow statement & statement of changes in equity -consolidated statement of financial position. -ratio analysis -depreciation methods -accounting concepts -understanding and application of all international financial reporting standards (ifrs) -international accounting standards (ias) -etc business analysis : -business strategy -strategic choices -business processes -e-business -e-marketing -project management -finance -hrm financial management : -project appraisal -capital budgeting -net present value (npv) -internal rate of return (irr) -net present value(npv) -payback period -strategic position -strategic choices -information technology -project management -finance -human resource management auditing: -internal audit -external audit -substantive procedures -analytic procedures -designing and assessment of internal controls -developing the flow charts & data flow diagrams -audit reports -engagement letter -materiality economics: -micro -macro -game theory -econometric -mathematical application in economics -empirical macroeconomics -international trade -international political economy -monetary theory and policy -public economics ,business law, and all regarding commerce
1+ Reviews
10+ Question Solved
Related Book For 

College Algebra With Modeling And Visualization
ISBN: 9780134418049
6th Edition
Authors: Gary Rockswold
Question Posted:
