

The graphs show the percentage of jobs in the U.S. labor force held by men and by
Question:
The graphs show the percentage of jobs in the U.S. labor force held by men and by women from 1970 through 2015. Exercises 109–110 are based on the data displayed by the graphs.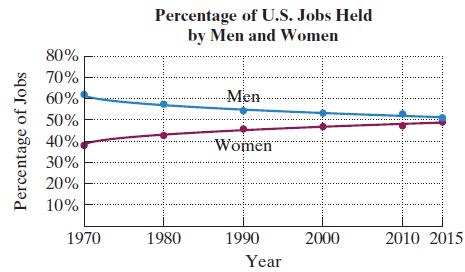
The formula![]() models the percentage of jobs in the U.S. labor force, p, held by women t years after 1970.a. Use the appropriate graph at the bottom of the previous column to estimate the percentage of jobs in the U.S. labor force held by women in 2010. Give your estimation to the nearest percent.b. Use the mathematical model to determine the percentage of jobs in the U.S. labor force held by women in 2010. Round to the nearest tenth of a percent.c. According to the formula, when will 51% of jobs in the U.S. labor force be held by women? Round to the nearest year.
models the percentage of jobs in the U.S. labor force, p, held by women t years after 1970.a. Use the appropriate graph at the bottom of the previous column to estimate the percentage of jobs in the U.S. labor force held by women in 2010. Give your estimation to the nearest percent.b. Use the mathematical model to determine the percentage of jobs in the U.S. labor force held by women in 2010. Round to the nearest tenth of a percent.c. According to the formula, when will 51% of jobs in the U.S. labor force be held by women? Round to the nearest year.
Step by Step Answer:
a According to the line graph about 47 1 of US women particip...View the full answer


