

Question: The table contains real data. Netflix Subscriptions (millions) (a) Determine the maximum and minimum values for each variable in the table. (b) Use your results
The table contains real data.
Netflix Subscriptions (millions)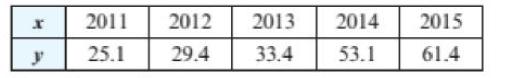
(a) Determine the maximum and minimum values for each variable in the table.
(b) Use your results from part (a) to find an appropriate viewing rectangle.
(c) Make a scatterplot of the data.
(d) Make a line graph of the data.
x 2011 2012 y 25.1 29.4 2013 33.4 2014 53.1 2015 61.4
Step by Step Solution
★★★★★
3.39 Rating (158 Votes )
There are 3 Steps involved in it
1 Expert Approved Answer
Step: 1 Unlock

a The maximum number of Netflix subscriptions is 614 mil... View full answer
Question Has Been Solved by an Expert!
Get step-by-step solutions from verified subject matter experts
Step: 2 Unlock
Step: 3 Unlock