

Question: The table contains real data. U.S. College Students Who Study Chinese (thousands) (a) Determine the maximum and minimum values for each variable in the table.
The table contains real data.
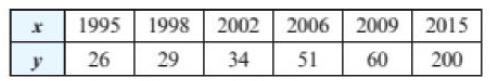
U.S. College Students Who Study Chinese (thousands)
(a) Determine the maximum and minimum values for each variable in the table.
(b) Use your results from part (a) to find an appropriate viewing rectangle.
(c) Make a scatterplot of the data.
(d) Make a line graph of the data.
3 y 1995 1998 26 29 2002 2006 2009 34 51 60 2015 200
Step by Step Solution
★★★★★
3.36 Rating (152 Votes )
There are 3 Steps involved in it
1 Expert Approved Answer
Step: 1 Unlock

a The maximum US college enrollments who study Chines... View full answer
Question Has Been Solved by an Expert!
Get step-by-step solutions from verified subject matter experts
Step: 2 Unlock
Step: 3 Unlock