

Question: The table lists U.S. demand for green building materials in billions of dollars for selected years. (a) Let x represent the number of years after
The table lists U.S. demand for green building materials in billions of dollars for selected years.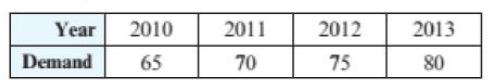
(a) Let x represent the number of years after 2010. Find a formula in slope-intercept form for a linear function f that models the data.
(b) Interpret the slope of the graph of y = f(x).
(c) Estimate the demand in 2020.
Year 2010 65 Demand 2011 70 2012 75 2013 80
Step by Step Solution
★★★★★
3.44 Rating (154 Votes )
There are 3 Steps involved in it
1 Expert Approved Answer
Step: 1 Unlock

a b Demand for green material is increasing at ... View full answer
Question Has Been Solved by an Expert!
Get step-by-step solutions from verified subject matter experts
Step: 2 Unlock
Step: 3 Unlock