

Question: The table lists the annual hours worked by the average worker in Europe for selected years. (a) Let x represent the number of years after
The table lists the annual hours worked by the average worker in Europe for selected years.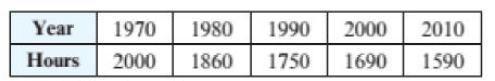
(a) Let x represent the number of years after 1970. Find a formula in slope-intercept form for a linear function f that models the data.
(b) Interpret the slope of the graph of y = f(x).
(c) Estimate the annual hours worked in 2014.
Year 1970 1980 1990 2000 2010 Hours 2000 1860 1750 1690 1590
Step by Step Solution
★★★★★
3.36 Rating (165 Votes )
There are 3 Steps involved in it
1 Expert Approved Answer
Step: 1 Unlock

a b Hours worked decreased on average by 1025 hour... View full answer
Question Has Been Solved by an Expert!
Get step-by-step solutions from verified subject matter experts
Step: 2 Unlock
Step: 3 Unlock