

The table shows the percent y of voter turnout in the United States for the presidential election
Question:
The table shows the percent y of voter turnout in the United States for the presidential election in year x, where x = 0 corresponds to 1900. Find a quadratic function defined by f(x) = ax2 + bx + c that models these data. Graph f together with the data.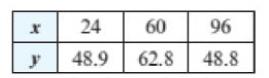
Fantastic news! We've Found the answer you've been seeking!
Step by Step Answer:
The constants a b and c must satisfy the following equati...View the full answer

Answered By
Carly Cimino
As a tutor, my focus is to help communicate and break down difficult concepts in a way that allows students greater accessibility and comprehension to their course material. I love helping others develop a sense of personal confidence and curiosity, and I'm looking forward to the chance to interact and work with you professionally and better your academic grades.
12+ Reviews
21+ Question Solved
Related Book For 

College Algebra With Modeling And Visualization
ISBN: 9780134418049
6th Edition
Authors: Gary Rockswold
Question Posted:
