

Question: Use a calculator with an e x key to solve Exercises 7176. The bar graph shows the percentage of U.S. high school seniors who applied
Use a calculator with an ex key to solve Exercises 71–76. The bar graph shows the percentage of U.S. high school seniors who applied to more than three colleges for selected years from 1980 through 2013.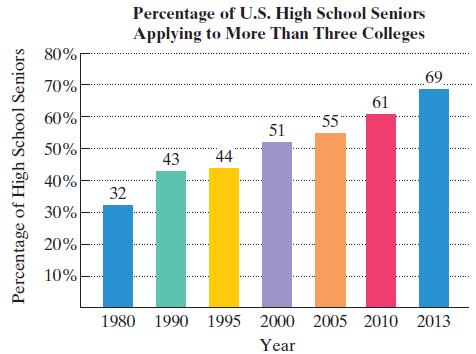 The bar graph shows the percentage of people 25 years of age and older who were college graduates in the United States for eight selected years.
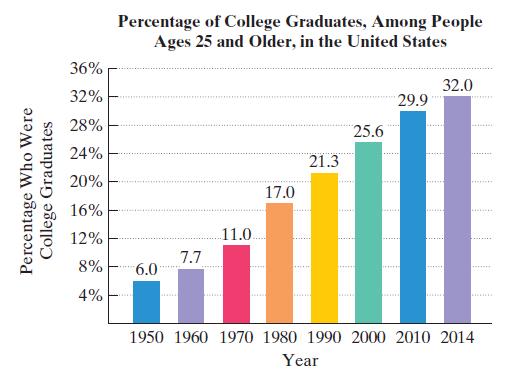
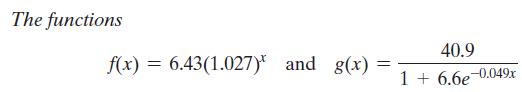 model the percentage of college graduates, among people ages 25 and older, f(x) or g(x), x years after 1950. Use these functions to solve Exercises 75–76.
Which function is a better model for the percentage who were college graduates in 1990?
Percentage of High School Seniors 80% 70% 60% 50% 40% 30% 20% 10% 32 Percentage of U.S. High School Seniors Applying to More Than Three Colleges 43 44 51 55 61 69 ********** 1980 1990 1995 2000 2005 2010 2013 Year
Step by Step Solution
3.41 Rating (173 Votes )
There are 3 Steps involved in it
fx 6251029 f40 6251029 40 19... View full answer

Get step-by-step solutions from verified subject matter experts