

Question: We opened this section with a study showing that late in the semester, procrastinating students reported more symptoms of physical illness than their nonprocrastinating peers.
We opened this section with a study showing that late in the semester, procrastinating students reported more symptoms of physical illness than their nonprocrastinating peers.
a. At the beginning of the semester, procrastinators reported an average of 0.8 symptoms, increasing at a rate of 0.45 symptoms per week. Write a function that models the average number of symptoms after x weeks.
b. At the beginning of the semester, nonprocrastinators reported an average of 2.6 symptoms, increasing at a rate of 0.15 symptoms per week. Write a function that models the average number of symptoms after x weeks.
c. By which week in the semester did both groups report the same number of symptoms of physical illness? For that week, how many symptoms were reported by each group? How is this shown in Figure 5.1
Figure 5.1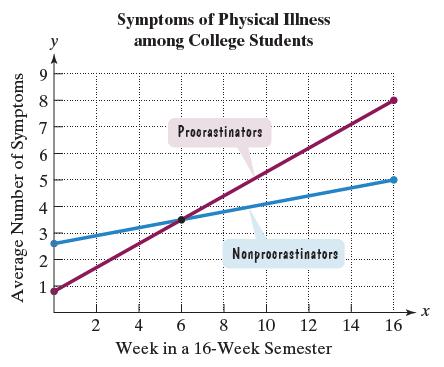
Average Number of Symptoms 96 5 2 2 Symptoms of Physical Illness among College Students Procrastinators Nonprocrastinators 4 6 8 Week in a 16-Week Semester 10 12 14 16 X
Step by Step Solution
3.27 Rating (156 Votes )
There are 3 Steps involved in it
a y 045x 08 b y 015x 26 c To find the week in the semester when both groups rep... View full answer

Get step-by-step solutions from verified subject matter experts