

Question: 12. Answer parts a through c based on a study showing that late in the semester, procrastinating students reported more symptoms of physical illness than
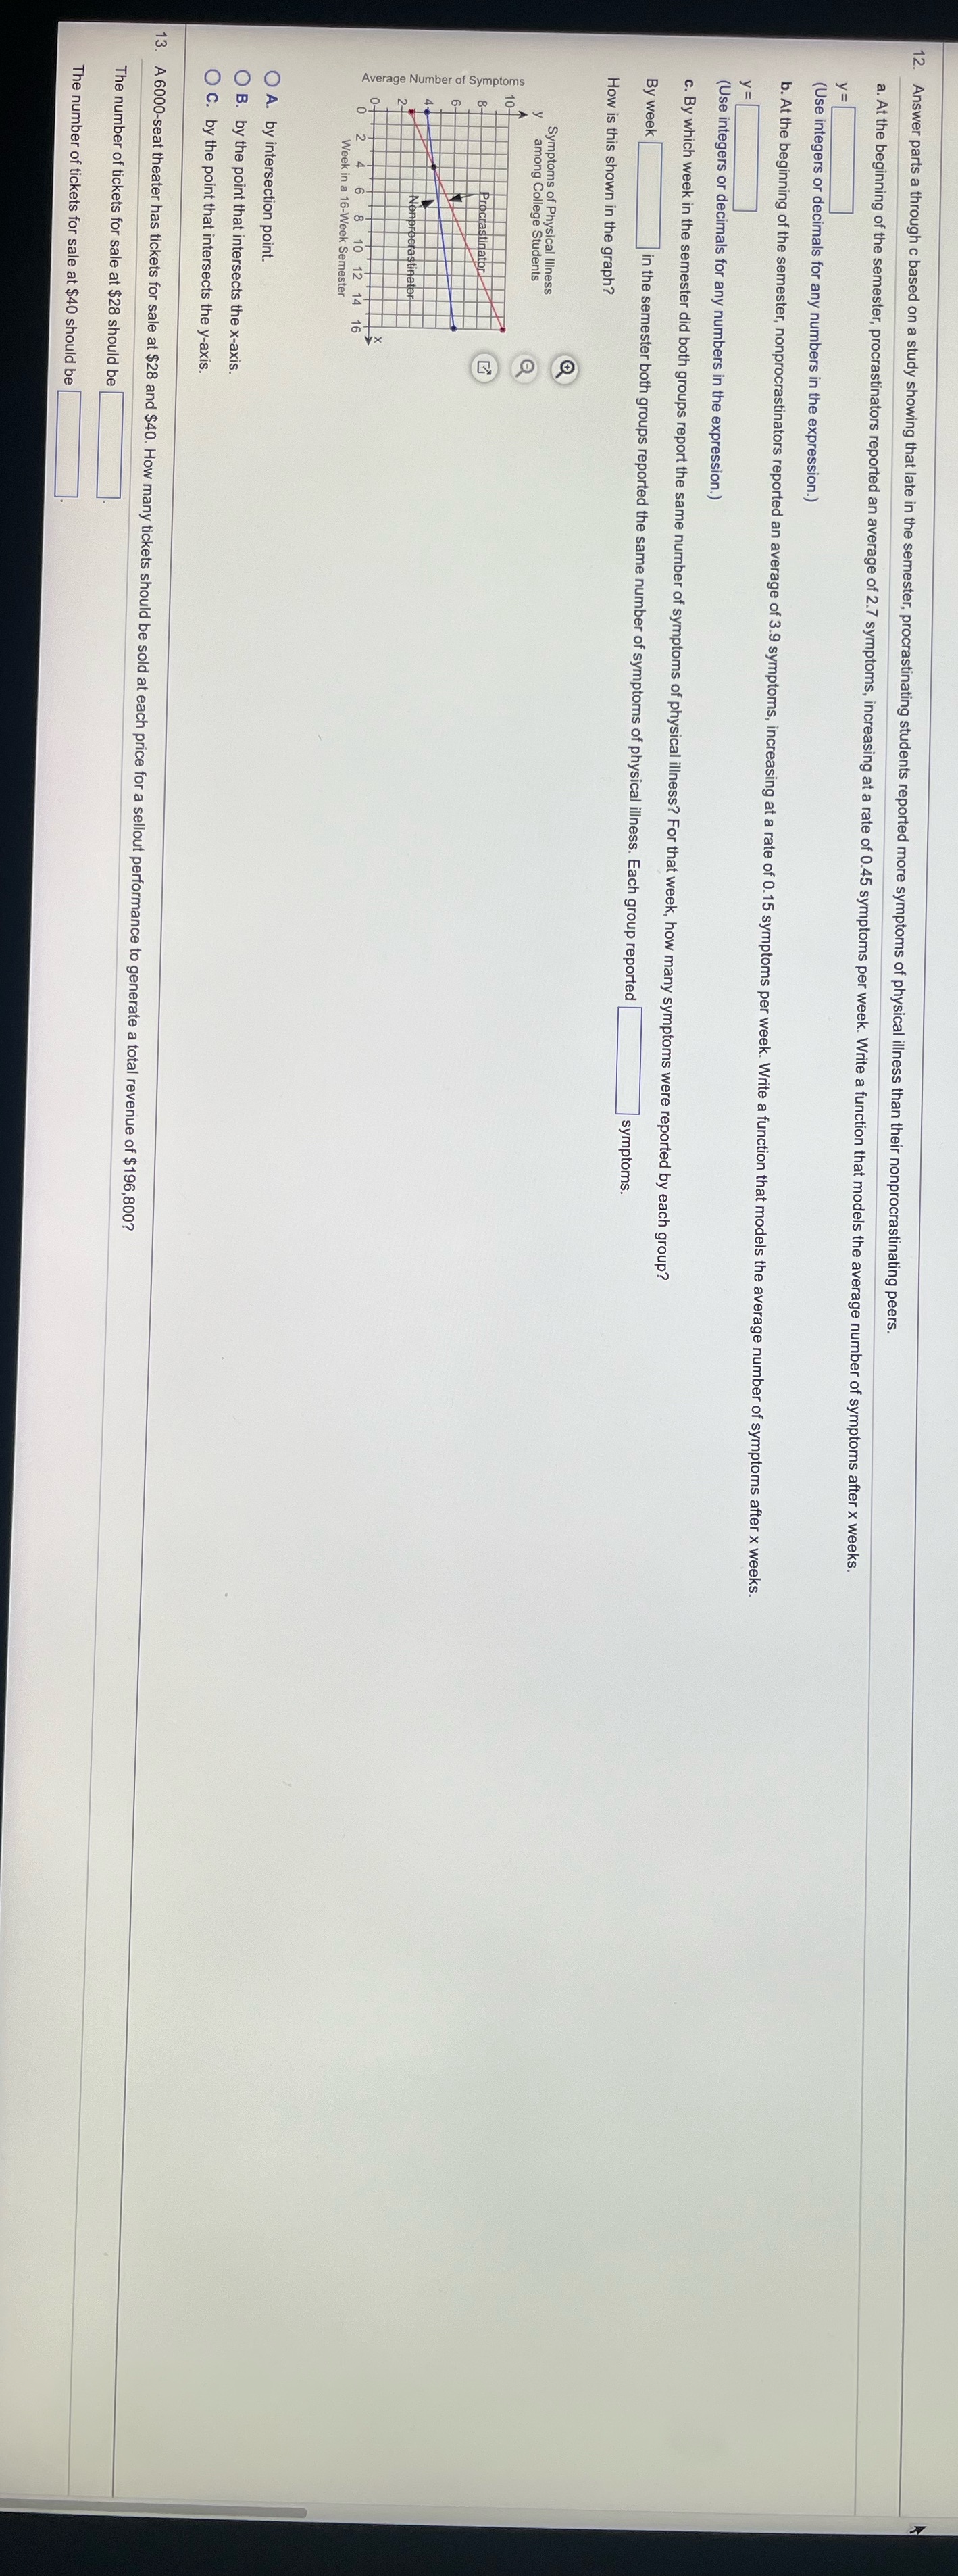
12. Answer parts a through c based on a study showing that late in the semester, procrastinating students reported more symptoms of physical illness than their nonprocrastinating peers. a. At the beginning of the semester, procrastinators reported an average of 2.7 symptoms, increasing at a rate of 0.45 symptoms per week. Write a function that models the average number of symptoms after x weeks. y= (Use integers or decimals for any numbers in the expression.) b. At the beginning of the semester, nonprocrastinators reported an average of 3.9 symptoms, increasing at a rate of 0.15 symptoms per week. Write a function that models the average number of symptoms after x weeks. y = (Use integers or decimals for any numbers in the expression.) C. By which week in the semester did both groups report the same number of symptoms of physical illness? For that week, how many symptoms were reported by each group? By week in the semester both groups reported the same number of symptoms of physical illness. Each group reported symptoms . How is this shown in the graph? Symptoms of Physical Illness among College Students 10- Procrastinator 6 Average Number of Symptoms 2Nonprocrastinator 16 8 10 12 14 16 "Week in a 16 -Week Semester O A. by intersection point. O B. by the point that intersects the x-axis. O C. by the point that intersects the y-axis. 13. A 6000-seat theater has tickets for sale at $28 and $40. How many tickets should be sold at each price for a sellout performance to generate a total revenue of $196,800? The number of tickets for sale at $28 should be The number of tickets for sale at $40 should be
Step by Step Solution
There are 3 Steps involved in it

Get step-by-step solutions from verified subject matter experts