

An individuals income varies with his or her age. The following table shows the median income I
Question:
An individual’s income varies with his or her age. The following table shows the median income I of males of different age groups within the United States for 2016. For each age group, let the class midpoint represent the independent variable, x. For the class “65 years and older,” we will assume that the class midpoint is 69.5.
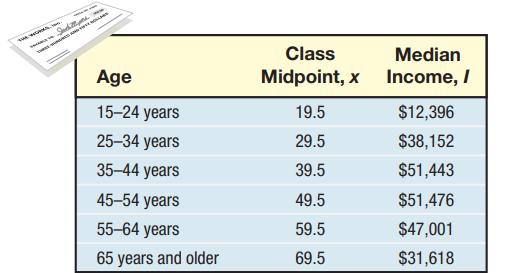
(a) Use a graphing utility to draw a scatter plot of the data. Comment on the type of relation that may exist between the two variables.
(b) Use a graphing utility to find the quadratic function of best fit that models the relation between age and median income.
(c) Use the function found in part (b) to determine the age at which an individual can expect to earn the most income.
(d) Use the function found in part (b) to predict the peak income earned.
(e) With a graphing utility, graph the quadratic function of best fit on the scatter plot.
Step by Step Answer:
a b c d e NORMAL FLOAT AUT...View the full answer


