

An individuals income varies with his or her age. The following table shows the median income I
Question:
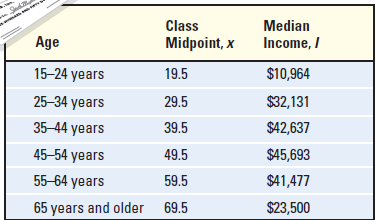
(a) Use a graphing utility to draw a scatter diagram of the data. Comment on the type of relation that may exist between the two variables.
(b) Use a graphing utility to find the quadratic function of best fit that models the relation between age and median income.
(c) Use the function found in part (b) to determine the age at which an individual can expect to earn the most income.
(d) Use the function found in part (b) to predict the peak income earned.
(e) With a graphing utility, graph the quadratic function of best fit on the scatter diagram.
Fantastic news! We've Found the answer you've been seeking!
Step by Step Answer:
a From the graph the data appear to follow a quadratic relatio...View the full answer

Answered By
Mary Njunu
I posses Vast, diversified knowledge and excellent grammar as a result of working in ACADEMIC WRITING for more than 5 years. I deliver work in various disciplines with assurance of quality work. I purpose at meeting the clients’ expectations precisely. Let’s work together for the best and phenomenal grades.
928+ Reviews
2551+ Question Solved
Related Book For 

Question Posted:
