

Question: In Problems 750, follow Steps 1 through 7 on page 367 to graph each function. Steps for Graphing a Rational Function R STEP 1: Factor
In Problems 7–50, follow Steps 1 through 7 on page 367 to graph each function.
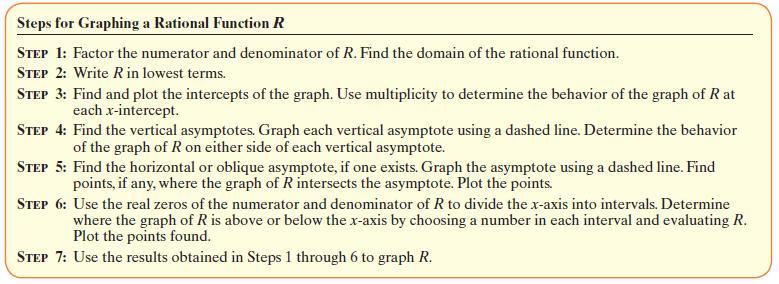
Steps for Graphing a Rational Function R STEP 1: Factor the numerator and denominator of R. Find the domain of the rational function. STEP 2: Write R in lowest terms. STEP 3: Find and plot the intercepts of the graph. Use multiplicity to determine the behavior of the graph of R at each x-intercept. STEP 4: Find the vertical asymptotes. Graph each vertical asymptote using a dashed line. Determine the behavior of the graph of R on either side of each vertical asymptote. STEP 5: Find the horizontal or oblique asymptote, if one exists. Graph the asymptote using a dashed line. Find points, if any, where the graph of R intersects the asymptote. Plot the points. STEP 6: Use the real zeros of the numerator and denominator of R to divide the x-axis into intervals. Determine where the graph of R is above or below the x-axis by choosing a number in each interval and evaluating R. Plot the points found. STEP 7: Use the results obtained in Steps 1 through 6 to graph R.
Step by Step Solution
3.39 Rating (155 Votes )
There are 3 Steps involved in it
fxx Step 1 1 x 1 x1x x1 X Step 4 Step 5 Step 6 x Step 2 3 fx Domain xx0 Ther... View full answer

Get step-by-step solutions from verified subject matter experts