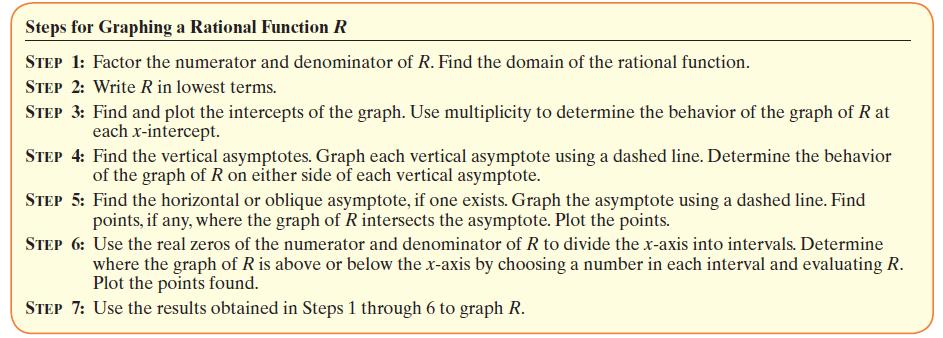
In Problems 750, follow Steps 1 through 7. Steps for Graphing a Rational Function R STEP 1:
Question:
In Problems 7–50, follow Steps 1 through 7.
Transcribed Image Text:
Steps for Graphing a Rational Function R STEP 1: Factor the numerator and denominator of R. Find the domain of the rational function. STEP 2: Write R in lowest terms. STEP 3: Find and plot the intercepts of the graph. Use multiplicity to determine the behavior of the graph of R at each x-intercept. STEP 4: Find the vertical asymptotes. Graph each vertical asymptote using a dashed line. Determine the behavior of the graph of R on either side of each vertical asymptote. STEP 5: Find the horizontal or oblique asymptote, if one exists. Graph the asymptote using a dashed line. Find points, if any, where the graph of R intersects the asymptote. Plot the points. STEP 6: Use the real zeros of the numerator and denominator of R to divide the x-axis into intervals. Determine where the graph of R is above or below the x-axis by choosing a number in each interval and evaluating R. Plot the points found. STEP 7: Use the results obtained in Steps 1 through 6 to graph R.
Fantastic news! We've Found the answer you've been seeking!
Step by Step Answer:
Answer rating: 44% (9 reviews)
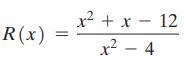
Rx Step 4 xx12 x4x3 x4 x2x2 Step 1 Domain xx2 x 2 Step 2 3 Rx Step 5 Step 6 The yintercept is R0 x4...View the full answer
Answered By
Utsab mitra
I have the expertise to deliver these subjects to college and higher-level students. The services would involve only solving assignments, homework help, and others.
I have experience in delivering these subjects for the last 6 years on a freelancing basis in different companies around the globe. I am CMA certified and CGMA UK. I have professional experience of 18 years in the industry involved in the manufacturing company and IT implementation experience of over 12 years.
I have delivered this help to students effortlessly, which is essential to give the students a good grade in their studies.
3.50+
2+ Reviews
10+ Question Solved
Related Book For
Question Posted:
Students also viewed these Mathematics questions
-
In Problems 750, follow Steps 1 through 7 on page 367 to graph each function. Steps for Graphing a Rational Function R STEP 1: Factor the numerator and denominator of R. Find the domain of the...
-
In Problems 750, follow Steps 1 through 7 on page 367 to graph each function. Steps for Graphing a Rational Function R STEP 1: Factor the numerator and denominator of R. Find the domain of the...
-
In Problems 750, follow Steps 1 through 7 on page 367 to graph each function. Steps for Graphing a Rational Function R STEP 1: Factor the numerator and denominator of R. Find the domain of the...
-
Monochromatic light from a distant source is incident on a slit 0.750mm wide. On a screen 2.00 m away, the distance from the central maximum of the diffraction pattern to the first minimum is...
-
Emily Smith decides to buy a fuel-efficient used car. Here are several vehicles she is considering, with the estimated cost to purchase and the age of the vehicle. a. Plot these data on a scatter...
-
Considering A-L to represent the major products formed in each of the following reactions, provide a structure for each of A through L. If more than one product can reasonably be conceived from a...
-
Nationwide Insurance developed a program to recruit new insurance agents by offering planning, training, and start-up financing to build self-sustaining agencies. These new agents would be...
-
Condensed financial statements for Dragoon Enterprises follow. (a) Calculate the amount of dividends Dragoon paid using the information given. (b) Prepare a statement of cash flows using the...
-
Levinn's utility function is expressed as the following: U= C1 C2 0.3 where C1 is his first period consumption and C2 is his second period consumption. His income in the first period is $2500 and...
-
In Problems 522, graph each polynomial function by following Steps 1 through 5. Steps for Graphing a Polynomial Function STEP 1: Determine the end behavior of the graph of the function. STEP 2: Find...
-
In Problems 1520, graph each rational function following the seven steps given on page 367. Steps for Graphing a Rational Function R STEP 1: Factor the numerator and denominator of R. Find the domain...
-
Define creativity. How does creativity contribute to the opportunity recognition process?
-
Inventories Raw materials inventory Work in process inventory Finished goods inventory Activity during current year Raw materials purchased Direct labor Factory overhead Beginning of Year $ 7,700...
-
Assume that peek(), pop(), push(), printStack() methods are defined in the Stack class. Also Node class is defined. Find the correct output: stack.push(100); stack.push(200); stack.push(500);...
-
The following data are available: Date year 2 - - - Concepts Units Unit Cost June 1 Begining inventory 1 0 0 2 9 , 5 June 4 Purchase 2 5 0 3 3 June 1 2 Sales 1 2 0 June 1 8 Purchase 4 0 0 3 0 June 2...
-
Accounts appearing in the December 31 trial balance of Marmara Inc. are listed below: Accounts Payable Capital Stock Accounts Receivable Bank Loan Dividends Rent Expense Salaries Expense Depreciation...
-
Which activities involve acquiring the resources to run the business? Operating Delivering Financing Investing
-
Explain how a plantwide overhead rate, using a unit-based driver, can produce distorted product costs. In your answer, identify two major factors that impair the ability of plantwide rates to assign...
-
What are the principal alloying elements in SAE 4340 steel?
-
Find each sum or difference, if possible. -2 [2 4 6] +|-4 -6
-
Find each sum or difference, if possible. 21 -6]
-
Find each sum or difference, if possible. -6 8 -4 -2
-
I'm creating a skip list program for my Algorithms and Advanced Data Structure class. I was tasked with implementing a find & add method for the skiplist. Here is my program, I'm running into a...
-
B) (8 points) In this exercise, you will find actual points on the combined PPC of the two states. For each of the following values of one good, calculate the maximum amount of the other good that...
-
Suppose you have N objects and N buckets. For each object, randomly place it into a bucket, with each of the N options being equally likely. Through this random process, some buckets may end up...
Study smarter with the SolutionInn App