

Question: Let C be the function whose graph is given below. This graph represents the cost C of manufacturing q computers in a day. (a) Find
Let C be the function whose graph is given below. This graph represents the cost C of manufacturing q computers in a day.
(a) Find C(0). Interpret this value.
(b) Find C(10). Interpret this value.
(c) Find C(50). Interpret this value.
(d) What is the domain of C? What does this domain imply in terms of daily production?
(e) Describe the shape of the graph.
(f) The point (30, 32 000) is called an inflection point. Describe the behavior of the graph around the inflection point.
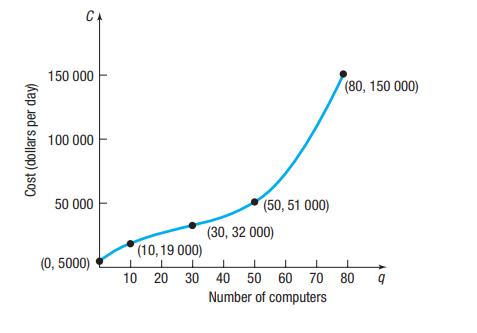
Cost (dollars per day) C 150 000 100 000 50 000 (0, 5000) (50, 51 000) (30, 32 000) (10,19 000) 1 1 L 10 20 30 40 50 60 70 Number of computers (80, 150 000) 80 9
Step by Step Solution
3.44 Rating (154 Votes )
There are 3 Steps involved in it
a b c d e f C0 5000 This repre... View full answer

Get step-by-step solutions from verified subject matter experts