

Question: Let C be the function whose graph is given below. This graph represents the cost C of using g gigabytes of data in a month
Let C be the function whose graph is given below. This graph represents the cost C of using g gigabytes of data in a month for a data-only plan.
(a) Find C (0). Interpret this value.
(b) Find C (5). Interpret this value.
(c) Find C (15). Interpret this value.
(d) What is the domain of C? What does this domain imply in terms of the number of gigabytes?
(e) Describe the shape of the graph.
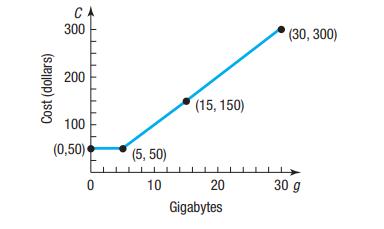
Cost (dollars) C 300 200 100 (0,50) 0 LL (5, 50) 10 (15, 150) 20 Gigabytes (30, 300) 30 g
Step by Step Solution
3.41 Rating (167 Votes )
There are 3 Steps involved in it
a b c d e ... View full answer

Get step-by-step solutions from verified subject matter experts