

Question: The data in the table below represent the number of dairy farms (in thousands) and the amount of milk produced (in billions of pounds) in
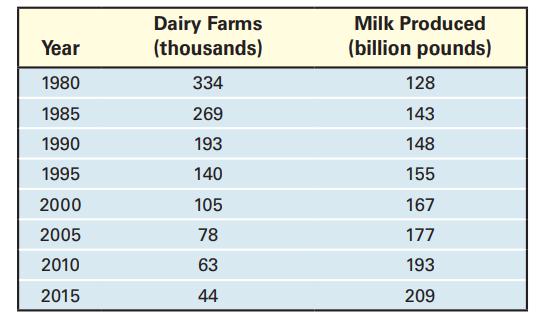
The data in the table below represent the number of dairy farms (in thousands) and the amount of milk produced (in billions of pounds) in the United States for various years.
(a) Using a graphing utility, draw a scatter plot of the data with the number of dairy farms as the independent variable.
(b) Using a graphing utility, build a logarithmic model from the data.
(c) Graph the logarithmic function found in part (b) on the scatter plot.
(d) In 2008, there were 67 thousand dairy farms in the United States. Use the function in part (b) to predict the amount of milk produced in 2008.
(e) The actual amount of milk produced in 2008 was 190 billion pounds. How does your prediction in part (d) compare to this?
Year 1980 1985 1990 1995 2000 2005 2010 2015 Dairy Farms (thousands) 334 269 193 140 105 78 63 44 Milk Produced (billion pounds) 128 143 148 155 167 177 193 209
Step by Step Solution
3.47 Rating (160 Votes )
There are 3 Steps involved in it
a b c d e NORMAL ... View full answer

Get step-by-step solutions from verified subject matter experts