

Question: a through d The data in the table below represent the number of dairy farms (in thousands) and the amount of milk produced (in billions
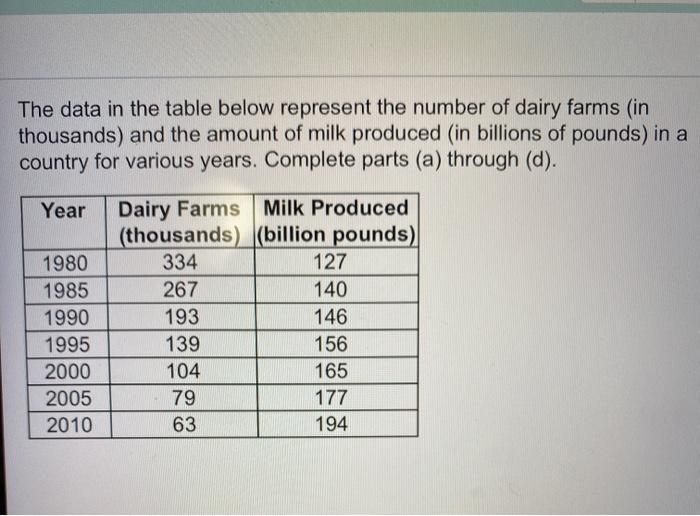
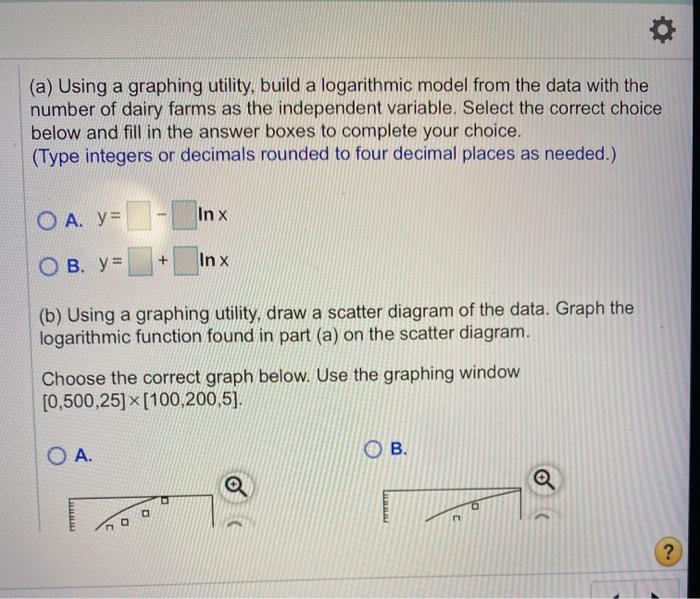
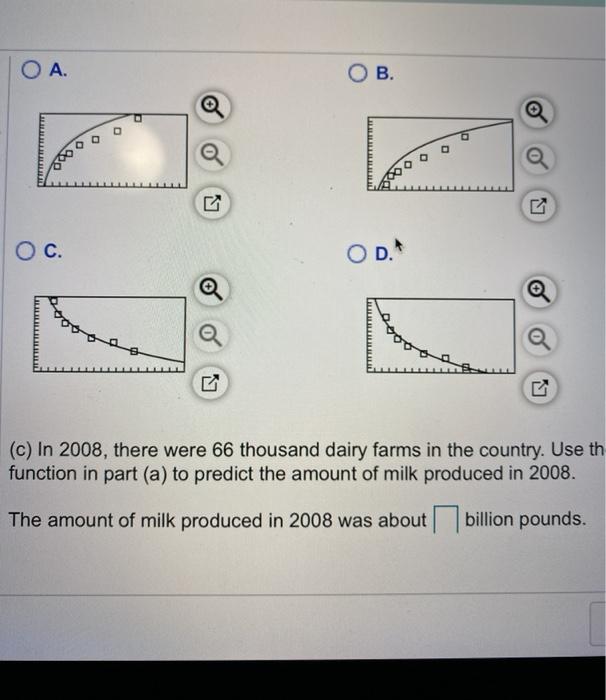
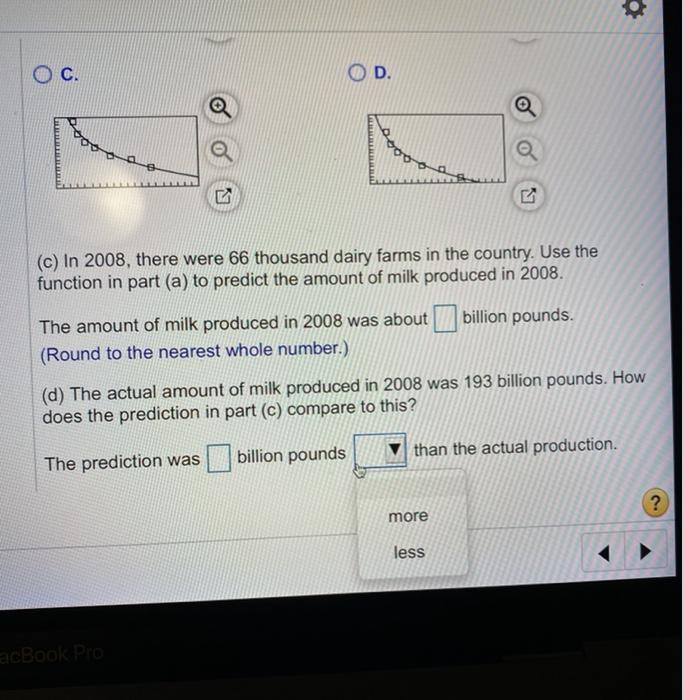
The data in the table below represent the number of dairy farms (in thousands) and the amount of milk produced (in billions of pounds) in a country for various years. Complete parts (a) through (d). Year 1980 1985 1990 1995 2000 2005 2010 Dairy Farms Milk Produced (thousands) (billion pounds) 334 127 267 140 193 146 139 156 104 165 79 177 63 194 (a) Using a graphing utility, build a logarithmic model from the data with the number of dairy farms as the independent variable. Select the correct choice below and fill in the answer boxes to complete your choice. (Type integers or decimals rounded to four decimal places as needed.) O A. y= - Inx x O B. y=+ In x (b) Using a graphing utility, draw a scatter diagram of the data. Graph the logarithmic function found in part (a) on the scatter diagram. Choose the correct graph below. Use the graphing window [0,500,25] [100,200,5). O A. B. ? O A. OB. 0 o 800 OC. OD. LALILILLILILILI (c) In 2008, there were 66 thousand dairy farms in the country. Use th function in part (a) to predict the amount of milk produced in 2008. The amount of milk produced in 2008 was about billion pounds. O C. D. Rooo a Da (c) In 2008, there were 66 thousand dairy farms in the country. Use the function in part (a) to predict the amount of milk produced in 2008. The amount of milk produced in 2008 was about billion pounds. (Round to the nearest whole number.) (d) The actual amount of milk produced in 2008 was 193 billion pounds. How does the prediction in part (c) compare to this? billion pounds than the actual production. The prediction was ? more less acBook Pro
Step by Step Solution
There are 3 Steps involved in it

Get step-by-step solutions from verified subject matter experts