

Question: The following data represent the average in-state tuition and fees (in 2017 dollars) at public four-year colleges and universities in the United States from the
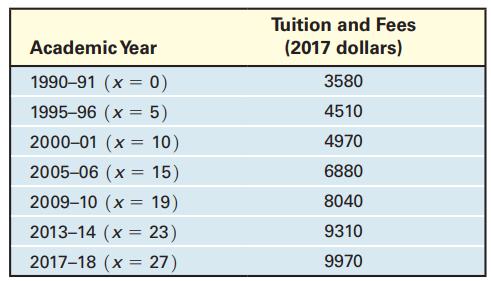
The following data represent the average in-state tuition and fees (in 2017 dollars) at public four-year colleges and universities in the United States from the academic year 1990–91 to the academic year 2017–18.
(a) Using a graphing utility, draw a scatter plot with academic year as the independent variable.
(b) Using a graphing utility, build an exponential model from the data.
(c) Express the function found in part (b) in the form A(t) = A0ekt.
(d) Graph the exponential function found in part (b) or (c) on the scatter plot.
(e) Predict the academic year when the average tuition will reach $16,000.
Academic Year 1990-91 (x = 0) 1995-96 (x = 5) 2000-01 (x = 10) 2005-06 (x = 15) 2009-10 (x19) 2013-14 (x 23) = 2017-18 (x 27) Tuition and Fees (2017 dollars) 3580 4510 4970 6880 8040 9310 9970
Step by Step Solution
3.44 Rating (154 Votes )
There are 3 Steps involved in it
a b c d e NO... View full answer

Get step-by-step solutions from verified subject matter experts