

The graph projects that the number of international travelers to the United States will increase from 51.2
Question:
The graph projects that the number of international travelers to the United States will increase from 51.2 million in 2000 to 90.3 million in 2020.
(a) Is this the graph of a function?
(b) What is the slope of the line in the graph? Interpret the slope in the context of international travelers to the United States.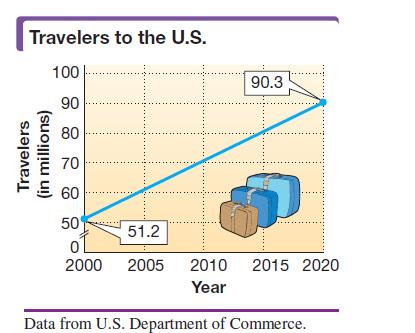
Fantastic news! We've Found the answer you've been seeking!
Step by Step Answer:
ANSWER a Yes the graph is of a function In a function each input xvalue is associated with o...View the full answer

Answered By
Collins Njuguna
I graduated from Maseno University with a Bachelor of Science in Applied Statistics. After graduation, I started tutoring students in mathematics. My experience in mathematics education is extensive and varied. I have taught a wide range of topics, including algebra, geometry, trigonometry, calculus, statistics, probability, and computer science. I have also worked with students of all ages and backgrounds, from elementary school to college.
My teaching method is based on the idea of hands-on learning. I believe that students learn best when they are actively engaged in the learning process, so I focus on giving students the tools they need to explore the material on their own. I also emphasize the importance of practice and review, as these are essential for mastering math concepts.
I have also developed several online and in-person courses on mathematics. My courses are designed to help students learn mathematics in an efficient and comprehensive way, and I use a variety of activities and exercises to ensure that my students are engaged and motivated.
Overall, my passion for mathematics and teaching has allowed me to be a successful tutor and educator in the field. I am confident that my experience will help your students master the mathematics they need to succeed.
0 Reviews
10+ Question Solved
Related Book For 

Intermediate Algebra
ISBN: 9780134895987
13th Edition
Authors: Margaret Lial, John Hornsby, Terry McGinnis
Question Posted:
