

The graph shows egg production in millions of eggs in selected states for 2015 and 2016. Use
Question:
The graph shows egg production in millions of eggs in selected states for 2015 and 2016. Use this graph to work each problem.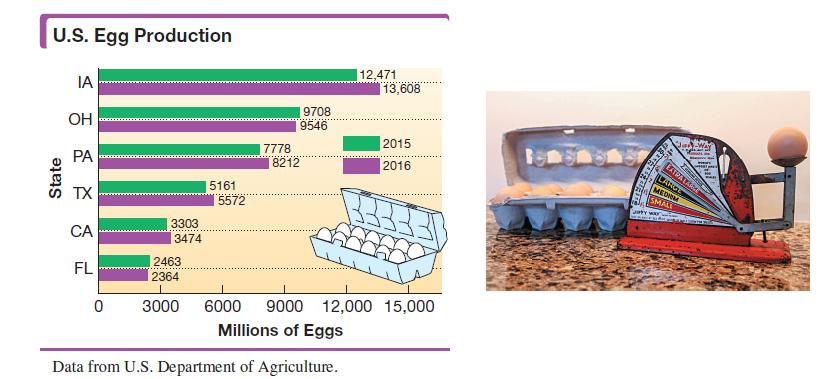
If x represents 2016 egg production for Texas (TX) and y represents 2016 egg production for Ohio (OH), which is true, x y?
Fantastic news! We've Found the answer you've been seeking!
Step by Step Answer:
From the given figure and the data If x repre...View the full answer

Answered By
Gloria Joseph
Hi,
I am a tutor in Mathematics subject. I love learning and teaching too. I understand that each student is unique and hence I need to change myself - while communicating with each one of the students - so as to make the activity of learning a play thing, once and then for ever!
I believe in activity-based learning, with the help of tools/games/students participating in events- especially outdoor ones. I also believe in continuous learning and teaching to keep myself up to date!
Cheers!!
0 Reviews
10+ Question Solved
Related Book For 

Intermediate Algebra
ISBN: 9780134895987
13th Edition
Authors: Margaret Lial, John Hornsby, Terry McGinnis
Question Posted:
