

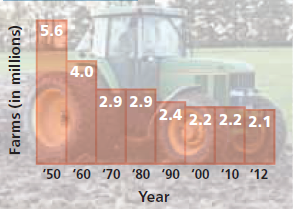
The graph shows the number of farms in the United States for selected years since 1950. We
Question:
The graph shows the number of farms in the United States for selected years since 1950. We can use the formula Number of farms = 0.001259x2 - 5.039x + 5044 to get a good approximation of the number of farms for these years by substituting the year for x and evaluating the polynomial. For example, if x = 1960, the value of the polynomial is approximately 4.1, which differs from the data in the bar graph by only 0.1.
Evaluate the polynomial for each year, and then give the difference from the value in the graph.
Number of Farms in the U.S. since 1950
1970
Fantastic news! We've Found the answer you've been seeking!
Step by Step Answer:
x 1970 0001...View the full answer

Answered By
CHARLES AMBILA
I am an experienced tutor with more than 7 years of experience. I have helped thousands of students pursue their academic goals. My primary objective as a tutor is to ensure that students have easy time handling their academic tasks.
109+ Reviews
323+ Question Solved
Related Book For 

College Algebra
ISBN: 978-0134697024
12th edition
Authors: Margaret L. Lial, John Hornsby, David I. Schneider, Callie Daniels
Question Posted:
