

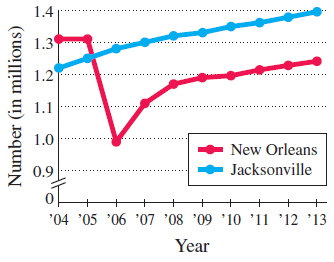
The graph shows the populations of the New Orleans, LA, and the Jacksonville, FL, metropolitan areas over
Question:
The graph shows the populations of the New Orleans, LA, and the Jacksonville, FL, metropolitan areas over the years 2004–2013.
Population of Metropolitan Areas
Why is each graph that of a function?
Fantastic news! We've Found the answer you've been seeking!
Step by Step Answer:
Answers will vary Sample ...View the full answer

Answered By
Carly Cimino
As a tutor, my focus is to help communicate and break down difficult concepts in a way that allows students greater accessibility and comprehension to their course material. I love helping others develop a sense of personal confidence and curiosity, and I'm looking forward to the chance to interact and work with you professionally and better your academic grades.
12+ Reviews
21+ Question Solved
Related Book For 

College Algebra
ISBN: 978-0134697024
12th edition
Authors: Margaret L. Lial, John Hornsby, David I. Schneider, Callie Daniels
Question Posted:
