

The graphs show regions of feasible solutions. Find the maximum and minimum values of each objective function.
Question:
The graphs show regions of feasible solutions. Find the maximum and minimum values of each objective function.
objective function = 6x + y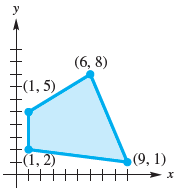
Fantastic news! We've Found the answer you've been seeking!
Step by Step Answer:
Point 1 2 15 68 91 Value of ...View the full answer

Answered By
Sarfraz gull
have strong entrepreneurial and analytical skills which ensure quality tutoring and mentoring in your international business and management disciplines. Over last 3 years, I have expertise in the areas of Financial Planning, Business Management, Accounting, Finance, Corporate Finance, International Business, Human Resource Management, Entrepreneurship, Marketing, E-commerce, Social Media Marketing, and Supply Chain Management.
Over the years, I have been working as a business tutor and mentor for more than 3 years. Apart from tutoring online I have rich experience of working in multinational. I have worked on business management to project management.
3+ Reviews
10+ Question Solved
Related Book For 

College Algebra
ISBN: 978-0134697024
12th edition
Authors: Margaret L. Lial, John Hornsby, David I. Schneider, Callie Daniels
Question Posted:
