

Question: The U.S. population, in millions, for selected years is given in the table. The bar graph shows the percentages of the U.S. population that lived
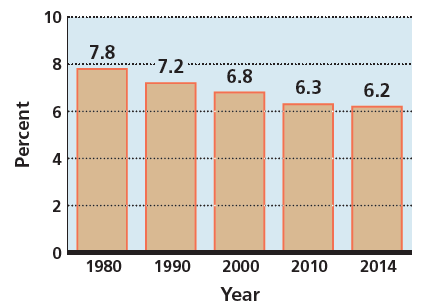
The U.S. population, in millions, for selected years is given in the table. The bar graph shows the percentages of the U.S. population that lived in New York State during those years.
Year............................................................U.S. Population(in millions)
1980......................................................................... 226.5
1990......................................................................... 248.7
2000......................................................................... 281.4
2010......................................................................... 308.7
2014......................................................................... 318.9
New York State Population as Percent of U.S. Population
(a) Find the number of Americans, to the nearest tenth of a million, living in New York State for each year given in the table.
(b) The percentages given in the bar graph decrease each year, while the populations given in the table increase each year. From the answers to part (a), is the number of Americans living in New York State increasing or decreasing?
10 7.8 7.2 ..**. .... 6.8 6.3 6.2 4 2010 1980 1990 2000 2014 Year Percent 2.
Step by Step Solution
3.33 Rating (159 Votes )
There are 3 Steps involved in it
a 1980 2265 million 0078 177 million 1990 2487 mi... View full answer

Get step-by-step solutions from verified subject matter experts