

Question: U.S. minimum hourly wage, in dollars, for selected years from 19562009 is shown in the table. The linear model y = 0.1132x + 0.4609 approximates
U.S. minimum hourly wage, in dollars, for selected years from 1956–2009 is shown in the table. The linear model
y = 0.1132x + 0.4609
approximates the minimum wage during this time period, where x is the number of years after 1956 and y is the minimum wage in dollars.
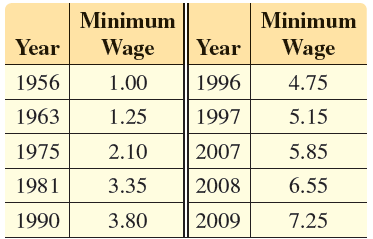

(a) Use the model to approximate the minimum wage in 1990. How does it compare to the data in the table?
(b) Use the model to approximate the year in which the minimum wage was $5.85. How does the answer compare to the data in the table?
Minimum Minimum Year Wage Wage Year 1956 1996 1.00 4.75 1963 1.25 1997 5.15 1975 2.10 2007 5.85 1981 6.55 3.35 2008 1990 3.80 2009 7.25
Step by Step Solution
3.32 Rating (149 Votes )
There are 3 Steps involved in it
a Using 1956 for x 0 then for 1990 x 34 According to the model the minim... View full answer

Get step-by-step solutions from verified subject matter experts