

Question: Using the given axes, draw a graph thatillustrates the following description.Profits for a business were $10 million in 2013. They rose sharply from 2013 through
Using the given axes, draw a graph thatillustrates the following description.Profits for a business were $10 million in 2013. They rose sharply from 2013 through 2015, remained constant from 2015 through 2017, and then fell slowly from 2017 through 2018.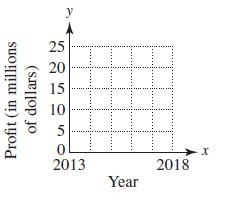
Profit (in millions of dollars) y 10 5 2013 Year 2018 X
Step by Step Solution
★★★★★
3.32 Rating (158 Votes )
There are 3 Steps involved in it
1 Expert Approved Answer
Step: 1 Unlock

We are given the following information about the profits for a business Profits in 2013 were 10 mill... View full answer
Question Has Been Solved by an Expert!
Get step-by-step solutions from verified subject matter experts
Step: 2 Unlock
Step: 3 Unlock