

Discuss the similarities and differences in the graphs of future value A as a function of time
Question:
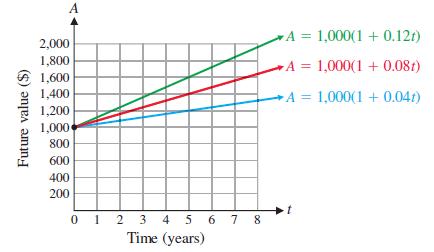
Discuss the similarities and differences in the graphs of future value A as a function of time t if $1,000 is invested at simple interest at rates of 4%, 8%, and 12%, respectively (see the figure).
Fantastic news! We've Found the answer you've been seeking!
Step by Step Answer:
To discuss the similarities and differences in the graphs of the future value A as a function of time t for different interest rates 4 8 and 12 lets a...View the full answer

Answered By
Akash M Rathod
I have been utilized by educators and students alike to provide individualized assistance with everything from grammar and vocabulary to complex problem-solving in various academic subjects. I can provide explanations, examples, and practice exercises tailored to each student's individual needs, helping them to grasp difficult concepts and improve their skills.
My tutoring sessions are interactive and engaging, utilizing a variety of tools and resources to keep learners motivated and focused. Whether a student needs help with homework, test preparation, or simply wants to improve their skills in a particular subject area, I am equipped to provide the support and guidance they need to succeed.
0 Reviews
10+ Question Solved
Related Book For 

College Mathematics For Business Economics, Life Sciences, And Social Sciences
ISBN: 978-0134674148
14th Edition
Authors: Raymond Barnett, Michael Ziegler, Karl Byleen, Christopher Stocker
Question Posted:
