

The accompainying table gives price supply data for the sale of hogs at a livestock market, where
Question:
The accompainying table gives price– supply data for the sale of hogs at a livestock market, where x is the number of pounds (in thousands) and p is the price per pound (in cents):
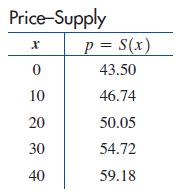
(A) Using quadratic regression to model the data, find the demand at a price of 52.50 cents per pound.
(B) Use a numerical integration routine to find the producers’ surplus (to the nearest dollar) at a price level of 52.50 cents per pound.
Fantastic news! We've Found the answer you've been seeking!
Step by Step Answer:
A Quadratic regression involves finding a quadratic function that best fits the data The general ...View the full answer

Answered By
BillClinton Muguai
I have been a tutor for the past 5 years. I have experience working with students in a variety of subject areas, including computer science, math, science, English, and history. I have also worked with students of all ages, from elementary school to college. In addition to my tutoring experience, I have a degree in education from a top university. This has given me a strong foundation in child development and learning theories, which I use to inform my tutoring practices.
I am patient and adaptable, and I work to create a positive and supportive learning environment for my students. I believe that all students have the ability to succeed, and it is my job to help them find and develop their strengths. I am confident in my ability to tutor students and help them achieve their academic goals.
0 Reviews
10+ Question Solved
Related Book For 

College Mathematics For Business Economics, Life Sciences, And Social Sciences
ISBN: 978-0134674148
14th Edition
Authors: Raymond Barnett, Michael Ziegler, Karl Byleen, Christopher Stocker
Question Posted:
