

The following tables give pricedemand and pricesupply data for the sale of soybeans at a grain market,
Question:
The following tables give price–demand and price–supply data for the sale of soybeans at a grain market, where x is the number of bushels of soybeans (in thousands of bushels) and p is the price per bushel (in dollars):
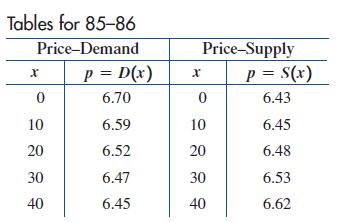
Use quadratic regression to model the price–demand data and linear regression to model the price–supply data.
(A) Find the equilibrium quantity (to three decimal places) and equilibrium price (to the nearest cent).
(B) Use a numerical integration routine to find the consumers’ surplus and producers’ surplus at the equilibrium price level.
Fantastic news! We've Found the answer you've been seeking!
Step by Step Answer:
To use quadratic regression to model the pricedemand data we first need to convert the table into two lists of data points PriceDemand p Dx 0 670 10 6...View the full answer

Answered By
Dulal Roy
As a tutor, I have gained extensive hands-on experience working with students one-on-one and in small group settings. I have developed the ability to effectively assess my students' strengths and weaknesses, and to customize my teaching approach to meet their individual needs.
I am proficient at breaking down complex concepts into simpler, more digestible pieces, and at using a variety of teaching methods (such as visual aids, examples, and interactive exercises) to engage my students and help them understand and retain the material.
I have also gained a lot of experience in providing feedback and guidance to my students, helping them to develop their problem-solving skills and to become more independent learners. Overall, my hands-on experience as a tutor has given me a deep understanding of how to effectively support and encourage students in their learning journey.
0 Reviews
10+ Question Solved
Related Book For 

College Mathematics For Business Economics, Life Sciences, And Social Sciences
ISBN: 978-0134674148
14th Edition
Authors: Raymond Barnett, Michael Ziegler, Karl Byleen, Christopher Stocker
Question Posted:
