

The table shows the retail market share of passenger cars from Ford Motor Company as a percentage
Question:
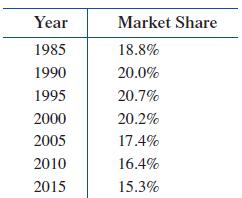
The table shows the retail market share of passenger cars from Ford Motor Company as a percentage of the U.S. market.
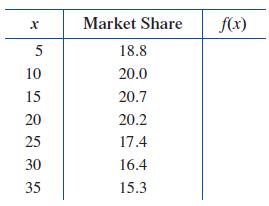
A mathematical model for this data is given by
f(x) = -0.0117x2 + 0.32x + 17.9
where x = 0 corresponds to 1980.
(A) Complete the following table. Round values of f(x) to one decimal place.
(B) Sketch the graph of f and the market share data in the same coordinate system.
(C) Use values of the modeling function f to estimate Ford’s market share in 2025 and in 2028.
(D) Write a brief verbal description of Ford’s market share from 1985 to 2015.
Fantastic news! We've Found the answer you've been seeking!
Step by Step Answer:
Step 1 b The graph of f and the market share data is p...View the full answer

Answered By
"Hello, my name is Anil. I am a dedicated and passionate educator with a strong background in education and tutoring. I hold a Bachelor's degree in Management from Bangalore University, where I graduated with honors. During my time at university, I developed a deep understanding of management concepts and a strong problem-solving ability.
After completing my degree, I embarked on a career in tutoring, driven by my desire to help students unlock their full potential. Over the past five years, I have worked as a private tutor, providing academic support and guidance to students from various grade levels.
My tutoring experience spans across multiple subjects, including mathematics, physics, and computer science. I have had the privilege of working with students from diverse backgrounds and learning styles, which has honed my ability to adapt my teaching methods to meet individual needs. By employing a patient and encouraging approach, I strive to create a positive and supportive learning environment where students feel comfortable asking questions and exploring new concepts.
In addition to my private tutoring experience, I have also worked as a teaching assistant at MANAIR High School, where I assisted in classroom instruction and provided one-on-one support to students struggling with math. This experience further enhanced my ability to effectively communicate complex ideas and break them down into more understandable concepts.
Continuing my commitment to professional development, I regularly attend workshops and conferences focused on the latest advancements in educational techniques and strategies. This allows me to stay up to date with best practices and incorporate innovative teaching methods into my tutoring sessions.
In summary, I am an experienced and dedicated tutor with a strong educational background in management. I have worked with students across various subjects and grade levels, providing academic support and fostering a positive learning environment. My goal is to empower students to succeed academically and develop a lifelong love for learning."
0 Reviews
10+ Question Solved
Related Book For 

College Mathematics For Business Economics, Life Sciences, And Social Sciences
ISBN: 978-0134674148
14th Edition
Authors: Raymond Barnett, Michael Ziegler, Karl Byleen, Christopher Stocker
Question Posted:
