

Using quadratic regression on a graphing calculator, show that the quadratic function that best fits the data
Question:
Using quadratic regression on a graphing calculator, show that the quadratic function that best fits the data on tire mileage in Problem 65 is
f(x) = -0.518x2 + 33.3x - 481
Problem 65
An automobile tire manufacturer collected the data in the table relating tire pressure x (in pounds per square inch) and mileage (in thousands of miles):
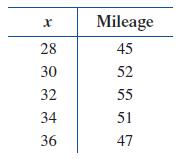
A mathematical model for the data is given by
f(x) = -0.518x2 + 33.3x - 481
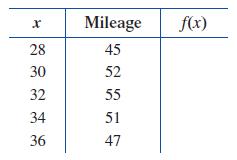
(A) Complete the following table. Round values of f(x) to one decimal place.
(B) Sketch the graph of f and the mileage data in the same coordinate system.
(C) Use the modeling function f(x) to estimate the mileage for a tire pressure of 31 lbs/sq in. and for 35 lbs/sq in. Round answers to two decimal places.
(D) Write a brief description of the relationship between tire pressure and mileage.
Step by Step Answer:
A tire pressure x mileage in thousands fx 28 45 6496 30 52 7094 32 55 7424 34 51 7084 36 47 6676 BTo ...View the full answer


College Mathematics For Business Economics, Life Sciences, And Social Sciences
ISBN: 978-0134674148
14th Edition
Authors: Raymond Barnett, Michael Ziegler, Karl Byleen, Christopher Stocker
