

Table 1 gives the percentage of U.S. adults who at least occasionally used social networking sites in
Question:
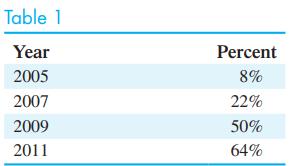
Table 1 gives the percentage of U.S. adults who at least occasionally used social networking sites in the given year.
The following transition matrix P is proposed as a model for the data, where I represents the population of social network users.
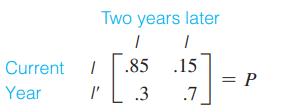
(A) Let S0 = [.08 .92] and find S1, S2, and S3. Compute both matrices exactly and then round entries to two decimal places.
(B) Construct a new table comparing the results from part (A) with the data in Table 1.
(C) According to this transition matrix, what percentage of the adult U.S. population will use the social networking sites in the long run?
Fantastic news! We've Found the answer you've been seeking!
Step by Step Answer:
Lets start with part A Given the transition matrix P and the initial state vector SO 085 07 P ...View the full answer

Answered By
PALASH JHANWAR
I am a Chartered Accountant with AIR 45 in CA - IPCC. I am a Merit Holder ( B.Com ). The following is my educational details.
PLEASE ACCESS MY RESUME FROM THE FOLLOWING LINK: https://drive.google.com/file/d/1hYR1uch-ff6MRC_cDB07K6VqY9kQ3SFL/view?usp=sharing
3+ Reviews
10+ Question Solved
Related Book For 

College Mathematics For Business Economics Life Sciences And Social Sciences
ISBN: 9780321945518
13th Edition
Authors: Raymond Barnett, Michael Ziegler, Karl Byleen
Question Posted:
