

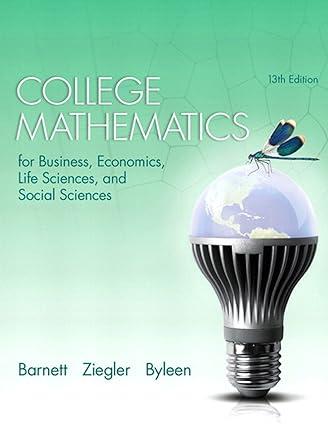
The command in Figure A was used on a graphing calculator to simulate 50 repetitions of rolling
Question:
The command in Figure A was used on a graphing calculator to simulate 50 repetitions of rolling a pair of dice and recording the minimum of the two numbers. A statistical plot of the results is shown in Figure B.
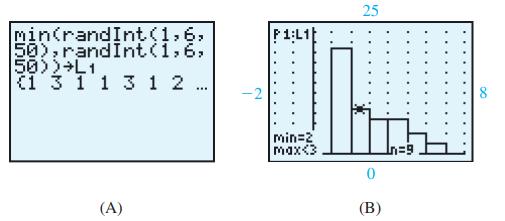
(A) Use Figure B to find the empirical probability that the minimum is 2.
(B) What is the theoretical probability that the minimum is 2?
(C) Using a graphing calculator to simulate 200 rolls of a pair of dice, determine the empirical probability that the minimum is 4 and compare with the theoretical probability.
Step by Step Answer:

This question has not been answered yet.
You can Ask your question!
Related Book For 
College Mathematics For Business Economics Life Sciences And Social Sciences
ISBN: 9780321945518
13th Edition
Authors: Raymond Barnett, Michael Ziegler, Karl Byleen
Question Posted:
