

The graph of the marginal cost function from the production of x thousand bottles of sunscreen per
Question:
The graph of the marginal cost function from the production of x thousand bottles of sunscreen per month [where cost C(x) is in thousands of dollars per month] is given in the figure.
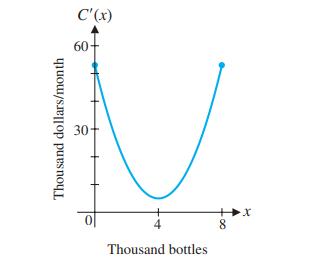
(A) Using the graph shown, describe the shape of the graph of the cost function C(x) as x increases from 0 to 8,000 bottles per month.
(B) Given the equation of the marginal cost function,
![]()
Find the cost function if monthly fixed costs at 0 output are $30,000. What is the cost of manufacturing 4,000 bottles per month? 8,000 bottles per month?
(C) Graph the cost function for 0 ≤ x ≤ 8.
(D) Why do you think that the graph of the cost function is steeper at both ends than in the middle?
Step by Step Answer:

This question has not been answered yet.
You can Ask your question!


College Mathematics For Business Economics Life Sciences And Social Sciences
ISBN: 9780321945518
13th Edition
Authors: Raymond Barnett, Michael Ziegler, Karl Byleen
