

Question: Figure Q2.17 shows an object's position-versus-time graph. What is the velocity of the object at t = 6 s? A. 0.67 m/s B. 0.83 m/s
Figure Q2.17 shows an object's position-versus-time graph. What is the velocity of the object at t = 6 s?
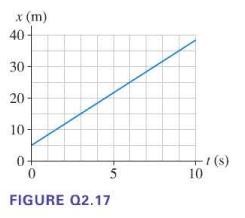
A. 0.67 m/s
B. 0.83 m/s
C. 3.3 m/s
D. 4.2 m/s
E. 25 m/s
x (m) 40 30- 20 10- 0- 5 FIGURE Q2.17 -1 (s) 10
Step by Step Solution
★★★★★
3.39 Rating (161 Votes )
There are 3 Steps involved in it
1 Expert Approved Answer
Step: 1 Unlock

x m 40 ... View full answer
Question Has Been Solved by an Expert!
Get step-by-step solutions from verified subject matter experts
Step: 2 Unlock
Step: 3 Unlock