

Question: Figure P2.20 shows several hypothetical accelerationtime graphs. For each case, sketch qualitatively a possible corresponding velocitytime graph. Figure P2.20 Case 2 Case 3 Case 1
Figure P2.20
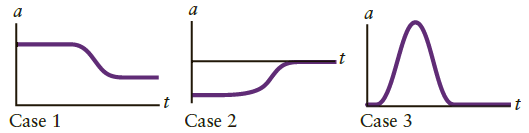
Case 2 Case 3 Case 1
Step by Step Solution
★★★★★
3.38 Rating (167 Votes )
There are 3 Steps involved in it
1 Expert Approved Answer
Step: 1 Unlock

Apply graphical analysis of motion including the defini... View full answer
Question Has Been Solved by an Expert!
Get step-by-step solutions from verified subject matter experts
Step: 2 Unlock
Step: 3 Unlock