

Figure P29.8 is an energylevel diagram for a simple atom. What wavelengths appear in the atom's (a)
Question:
Figure P29.8 is an energylevel diagram for a simple atom. What wavelengths appear in the atom's
(a) emission spectrum and
(b) absorption spectrum?
An electron with \(2.0 \mathrm{eV}\) of \(n=3 \longrightarrow E_{3}=4.0 \mathrm{eV}\)
\(n=2 \longrightarrow E_{2}=1.5 \mathrm{eV}\)
\(n=1 \longrightarrow E_{1}=0.0 \mathrm{eV}\)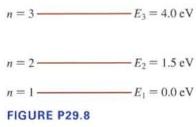
Fantastic news! We've Found the answer you've been seeking!
Step by Step Answer:
To determine the wavelengths that appear in the atoms emission and absorption spectra we need to con...View the full answer

Answered By
Carly Cimino
As a tutor, my focus is to help communicate and break down difficult concepts in a way that allows students greater accessibility and comprehension to their course material. I love helping others develop a sense of personal confidence and curiosity, and I'm looking forward to the chance to interact and work with you professionally and better your academic grades.
12+ Reviews
21+ Question Solved
Related Book For 

College Physics A Strategic Approach
ISBN: 9780321907240
3rd Edition
Authors: Randall D. Knight, Brian Jones, Stuart Field
Question Posted:
