

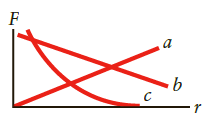
Question: Which graph in Figure P17.13, a, b, or c, best describes how the electric force between two point charges varies with their separation, r? Figure
Which graph in Figure P17.13, a, b, or c, best describes how the electric force between two point charges varies with their separation, r?
Figure P17.13
F a
Step by Step Solution
★★★★★
3.35 Rating (170 Votes )
There are 3 Steps involved in it
1 Expert Approved Answer
Step: 1 Unlock

The electric force on two charged particles separated by ... View full answer
Question Has Been Solved by an Expert!
Get step-by-step solutions from verified subject matter experts
Step: 2 Unlock
Step: 3 Unlock