

Question: Based on Figure 12.3, how do we interpret success in an Aloha network? Figure 12.3 Station has Legend a frame to send K : Number
Figure 12.3
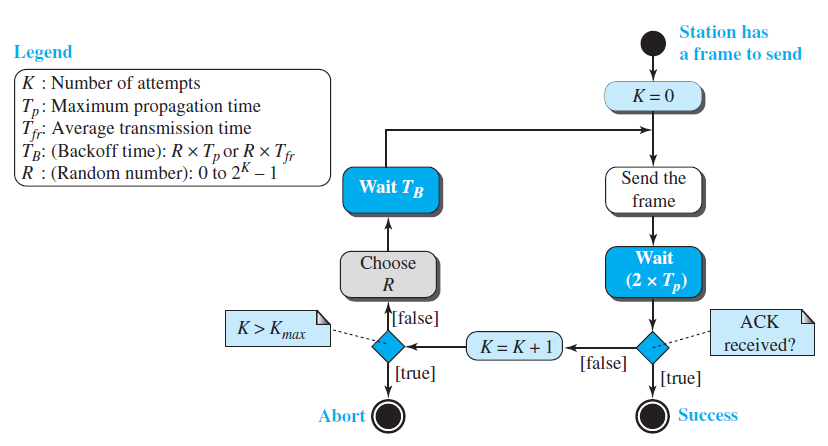
Station has Legend a frame to send K : Number of attempts Tp: Maximum propagation time Tr: Average transmission time TR: (Backoff time): R T,or R Tfr R : (Random number): 0 to 2K 1 K = 0 Send the Wait TB frame Wait Choose (2 ) [false] ACK > K = K + 1 received? [false] [true] [true] Success Abort
Step by Step Solution
★★★★★
3.43 Rating (166 Votes )
There are 3 Steps involved in it
1 Expert Approved Answer
Step: 1 Unlock

Success in an Alo... View full answer
Question Has Been Solved by an Expert!
Get step-by-step solutions from verified subject matter experts
Step: 2 Unlock
Step: 3 Unlock