

Question: Based on Figure 12.13, how do we interpret success in an Aloha network? Figure 12.13 Figure 12.13 Flow diagram for the CSMA/CD Station has a
Based on Figure 12.13, how do we interpret success in an Aloha network?
Figure 12.13
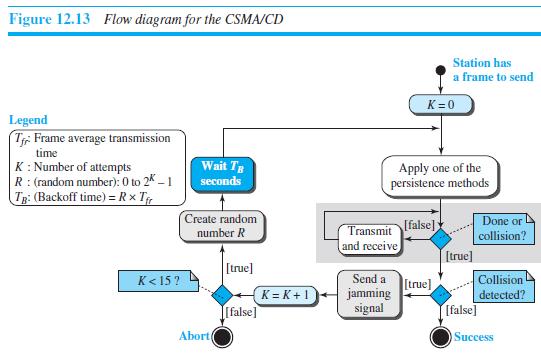
Figure 12.13 Flow diagram for the CSMA/CD Station has a frame to send K=0 Legend T Frame average transmission time K: Number of attempts R: (random number): 0 to 2K 1 TR: (Backoff time) = Rx T Wait Tg seconds Apply one of the persistence methods Create random number R Transmit Ifalse] and receive Done or collision? [true] [true] Send a [true] jamming K < 15 ? Collision K = K+1 [false] detected? signal [false] Abort Success
Step by Step Solution
3.45 Rating (158 Votes )
There are 3 Steps involved in it
Success in a CSMACD ne... View full answer

Get step-by-step solutions from verified subject matter experts