

Question: The horizontal axes in Figures 7.6 and 7.9 represent frequencies. The horizontal axis in Figure 7.16 represents wavelength. Can you explain the reason? If the
The horizontal axes in Figures 7.6 and 7.9 represent frequencies. The horizontal axis in Figure 7.16 represents wavelength. Can you explain the reason? If the propagation speed in an optical fiber is 2 × 10⁸m, can you change the units in the horizontal axis to frequency? Should the vertical-axis units be changed too? Should the curve be changed too?
Figure 7.6
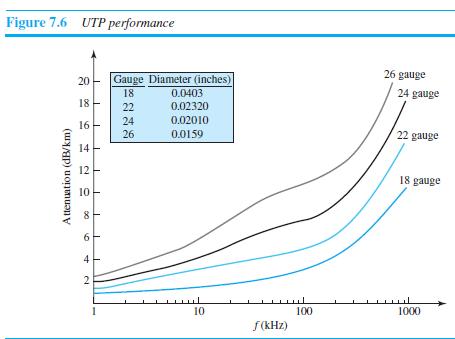
Figure 7.9
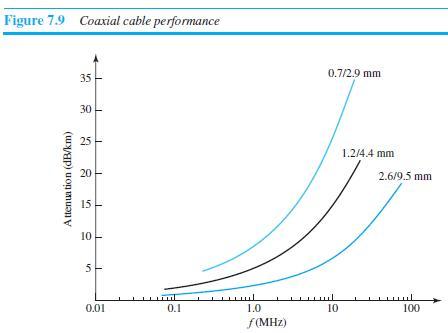
Figure 7.16
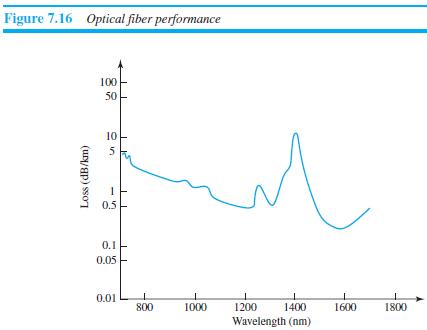
Figure 7.6 UTP performance 26 gauge Gauge Diameter (inches) 0.0403 0.02320 20 18 24 gauge 18 22 24 0.02010 16 26 0.0159 22 gauge 14 - 12 18 gauge 10 4 10 100 1000 f (KHz) A ttenuation (dB/km) 2.
Step by Step Solution
3.32 Rating (155 Votes )
There are 3 Steps involved in it
a The wave length is the inverse of the frequency if the propagation speed ... View full answer

Get step-by-step solutions from verified subject matter experts