

Question: Explain how you can tell the histogram does NOT represent normally distributed data. 5 10 15 20
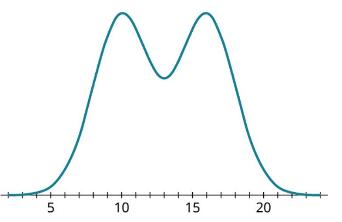
Explain how you can tell the histogram does NOT represent normally distributed data.
5 10 15 20
Step by Step Solution
★★★★★
3.34 Rating (160 Votes )
There are 3 Steps involved in it
1 Expert Approved Answer
Step: 1 Unlock

Question Has Been Solved by an Expert!
Get step-by-step solutions from verified subject matter experts
Step: 2 Unlock
Step: 3 Unlock