

Question: Make a stem-and-leaf plot to visualize these results. An elementary school class is administered a standardized test for which scores range from 0 to 100
Make a stem-and-leaf plot to visualize these results.
An elementary school class is administered a standardized test for which scores range from 0 to 100 , as shown below:
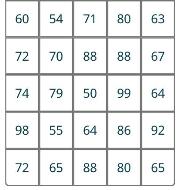
60 60 54 71 80 63 72 70 88 88 67 74 79 50 99 64 98 55 64 86 92 72 65 88 80 65
Step by Step Solution
★★★★★
3.41 Rating (145 Votes )
There are 3 Steps involved in it
1 Expert Approved Answer
Step: 1 Unlock

Question Has Been Solved by an Expert!
Get step-by-step solutions from verified subject matter experts
Step: 2 Unlock
Step: 3 Unlock