

Question: Use the appropriate applet to construct a simulated null distribution using the MAD statistic. Mark the observed MAD statistic calculated in the previous question on
a. Paste a screen shot or draw your null distribution below with the observed MAD marked and the approximate p-value shaded in.
b. Is the observed statistic out in the tail of this null distribution or is it a fairly typical result?
c. What is the p-value from your simulation? Based on this simulation analysis, would you conclude that the experiment provides strong evidence against the null hypothesis and that there is a significant difference in at least one of the mean aggression scores for the three experimental groups? Explain your reasoning.
The following table provides descriptive statistics on the measurements for aggression:
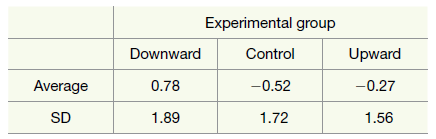
Experimental group Control Downward Upward Average -0.52 -0.27 0.78 1.89 1.72 1.56 SD
Step by Step Solution
★★★★★
3.40 Rating (153 Votes )
There are 3 Steps involved in it
1 Expert Approved Answer
Step: 1 Unlock

a See graph below b The observed statistic is out in the tail of t... View full answer
Question Has Been Solved by an Expert!
Get step-by-step solutions from verified subject matter experts
Step: 2 Unlock
Step: 3 Unlock