

Question: The data in AvgSAT (https://openstax.org/r/Chapter8 Data-Sets) contains the average SAT score for students attending every institution of higher learning in the United States for which
The data in "AvgSAT" (https://openstax.org/r/Chapter8 Data-Sets) contains the average SAT score for students attending every institution of higher learning in the United States for which data is available. In Example 8.12, we created a histogram for these data:
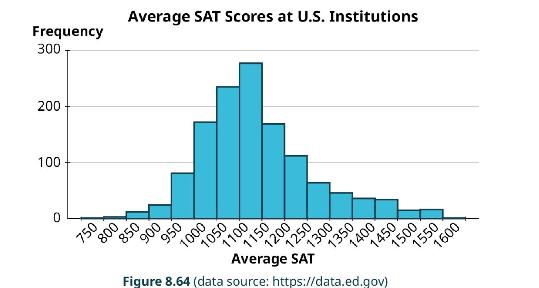
This distribution is fairly symmetric (it's just a little right-skewed) and bell-shaped, so we can use normal distribution techniques to analyze the data.
1. What is the mean of these average SAT scores?
2. What is the standard deviation of these SAT scores?
3. Using the answers to the previous two questions, use NORM.DIST in Google Sheets to estimate at what percentile the University at Buffalo in New York (average SAT: 1250) falls.
4. Use PERCENTRANK to find the actual percentile of the University at Buffalo, and see how close the estimate in the previous question came.
0 100 200 750 800 Frequency 300 850 900 Average SAT Scores at U.S. Institutions 950 1000 1050 1100 1150 1200 1250 1300 Figure 8.64 (data source: https://data.ed.gov) 1350 1400 1450 1500 1550 1600
Step by Step Solution
3.47 Rating (163 Votes )
There are 3 Steps involved in it

Get step-by-step solutions from verified subject matter experts